All assignments will be given in this Jupyter Notebook generated HTML webpage or PDF file.
Your solutions or code to the assignments must be submitted to the corresponding Brightspace Discussion Forum. We adopt an open-source, co-learning approach for this class, in which you can view solutions from all others once you submit yours. You are also required to make comments, at least one meaningful and insightful comment, to the code of others. The purpose of this practice is to learn from each other, better calibrate your learning goals, and move forward as a group.
As the course has no exams and all the assignments will be open, the project will play an important role in your final grade. So, plan early and plan well on your project. Whenever possible, think about how what we learn can be applied to your project.
This is an optional assignment that is mainly used to get you familiar with the way how assignments work in this class. Essentially, you need to submit your answers, solutions, and/or code to Brightspace Discussions Forum.
Note that the Birghtspace forum itself is also a type of Markup or Markdown document, where we can mark different elements in different styles. Specifically for this course, we can insert images as well as well-formatted Python code in the post. Make sure you know how to do this after we learn that in the lecture.
Task 1 Install Python with Miniforge, Conda, or Miniconda
Install Python through Miniforge (recommended), Anaconda or Miniconda. If you prefer other ways of installing Python and managing Python pacakges, feel free to use them. However, our course will assume the Python in the Anaconda-compatible ecosystem.
Miniforge is essentially the community version of mini-Anaconda. It uses the conda-forge channel by default. Miniforge adopts the mamba as its default package management program in the begining. The latest version of Anaconda and miniconda is also using this tool as well. Mamba, a conda equivalence rewritten in C/C++, is much faster than conda at multiple tasks, but particularly dependency resolving. Therefore, we recommend miniforge + Visual Studio Code as the two main features of our Python learning environment.
Once you installed conda, mimiconda, or miniforge, you will be able to run the relevant command line tools. On Windows, it is "Anaconda Prompt" and on Mac it is just "Terminal." All conda commands work under miniforge. We can also replace all conda with mamba in conda commands as shown below.
Some of the most commonly used conda commands.
Create a new Python/Conda Environment
conda create -n geocompShow the Python environments available
conda info -eorconda info --envsorconda env listActivate a particular environment (choose one from the list returned). By default, there is a
baseenvironment. Assuming you have a separate environment specifically for geocompuation namedpy-geocp, you can activate it.conda activate py-geocporactivate py-geocpInstall a Python package, including Python itself, from the public and popular
conda-forgerepositoryconda install -c conda-forge python=3.13conda install -c conda-forge pandasList packages in the current environment
conda listfor all,conda list pandasfor packages whose name contains pandasCheck versions of Python and Conda
conda --version,conda -Vandpython --version,python -VUpdate all packages in the current environment
conda update -c conda-forge --all
To create new conda environment such as py-geocp with a Python version of 3.13 and a few packages, we can simple run the following commands.
conda create --name py-geocporconda create -n py-geocpconda activate py-geocpconda install -c conda-forge python=3.13conda install -c conda-forge pandas plotly geopandas
A more complete desciption of creating and managing conda environments is available in conda documentation
For the assignment, show all the Python environments on your computer. Update all the packages in your chosen environment. Post the results to Brightspace.
Write Python code to print the famous Hello World! line. This is to verify that your Python environment works properly. You can either do this in a Python Notebook environment or a pure Python script file.
Post the Python code to Brightspace and format it using the Code (Python) format.
Python basics on variables, function calls, list, loops, etc.
Task 1 Get the Python version on your computer.
Create a Python script file or Jupyter Notebook in Visual Studio Code to accomplish this simple task. This task is to verify that Python works properly in Visual Studio Code on your computer. Save the file to a Workspace by using "Save Workspace As" in VS Code (see below). In most real-world applications, we use Workspace to organize program files, data files, and other relevant resources.
import platform
print(platform.python_version())
For a normal Visual Studio Code Python environment:
- Install the necessary and optional Extensions like Python, Jupyter, Pylance, Code Spell Checker, etc.
- Work with a VS code workspace
- Save files into the workspace (File -> Save Workspace As)
- Add additional folders like data folders, other code file folders to the workspace
- Always work on Python and Jupyter files in a Workspace
- Set the Python environment for the workspace
Add the following code to you first Python script file (Python script file is a pure Python file without Markdown) or Jupyter Notebook file. The code basically list all Jupyter Notebook files ending with .ipynb in the current working folder.
# List the current working folder and its content
import os
curFolder = os.getcwd()
print("The current working folder is " + curFolder)

filesDirs = os.listdir(curFolder)
# This is a list. We can print the entire list
# print(filesDirs)

#  We can also loop through each of them and print those ends with .ipynb
for fileDir in filesDirs:
    if fileDir.endswith(".ipynb"):
        # print(fileDir)
        print(f'{fileDir}')
        # print('error')
Do not use existing statistical functions or packages for the task. Write your own code.
- Generate a list of random numbers using random module in Python
- Alternatively, you can have a list of numbers such as [7,4,2,3,4,7,8,4,5,3,2,8,9]
- Calculate the mean value for the list by looping through its elements $$ \mu = \frac{\sum_{1}^{n}x_i}{n} $$
- Calculate the variance of the list $$ Var(X) = \frac{\sum_{1}^{n}(x_i-\mu)^2}{n} $$
# Some example to start
from random import seed, sample
seed(1009) # specify a random seed for replicability
# range method generate a list from 0 to 200 (not included) by step of 1
# sample method in random package then randomly selects a given #, i.e., 50, of elements from the list
rndList_1  = sample(range(0, 200, 1), 50)
print(rndList_1)
# A slightly different way
import random
random.seed(1009)
rndList_2 = []
for i in range(1, 50):
    rndList_2.append(random.randint(0, 200))

print(rndList_2)
# Manual list
randList_3 = [2, 3, 7.3, 9, 343, 23, 12, 56, 98, 23]
Further application of Python basics. Do not use existing functions in Python packages. Use the basic Python data structure and loops to do the work.
Task 1 Make a list of unique US county names
Read in a data file of all counties in the US. Make a list of unique county names.
We can read it from a local file on your computer drive using open function.
The json file may need to be re-saved on your computer if you see some reading errors. Just open the JSON file in VS Code and "Save As" the same file. This "save as" will force the file to use the proper encoding mechanism that works with your computer.
# Data Source https://eric.clst.org/assets/wiki/uploads/Stuff/gz_2010_us_050_00_5m.json
# Read from a local file
import json

# Use "with ... as ..." to better handle exceptions
with open("gz_2010_us_050_00_20m.json", 'r') as f:
  data = json.load(f)

print('Number of Counties in US: {}'.format(len(data['features'])))

# The name of the first feature
print(f"The second feature name is {data['features'][1]['properties']['NAME']}")
Alternatively, we can directly read it from an online source using requests.
# May or may not run. Check the online source if it does not work.
import requests, json
url = "https://eric.clst.org/assets/wiki/uploads/Stuff/gz_2010_us_050_00_5m.json"

with requests.get(url) as response:
    data = response.json()
    # Two different ways of composing text messages. The format function is preferred.

    # Three different ways of printing messages
    # 1. Use + to concatenate strings, or "," for multiple values.
    print('Number of Counties in US: ' + str(len(data['features'])))
    print('Number of Counties in US:', len(data['features']))
    # 2. Use format function
    print('The first entry is {}'.format(data['features'][0]['properties']['NAME']))
    # 3. use f to print
    print(f'The second entry is {data["features"][1]["properties"]["NAME"]}')

    # Work on this "data" variable using loops and the data structures of list, dictionary, and set.
Derive the numbers of counties that use these three names, respectively. For each of them, list their county name and state code.
Hint: Think about what data structure would be best for this task. Once again, do not use special functions or packages for this task. Just use basic Python data structures and loops.
'''
This sample code illustrate the basic logic of looping through the List of features.
Note GeoJSON is a multi-level combination of List and Dictionary.
All JSON files, including GeoJSON, are plain text file.
You can open them directly and see what are inside the files.
'''
# This will be a list of Feature
featureList = data['features']
cntyDict = {}

for f in featureList:
    # f will be an individual feature, i.e., a county for this data set

    # name will be the county name
    name = f['properties']['NAME']

    # if cntyDict.get(name) == None:
    # or
    if cntyDict.get(name) is None:
        # This one use an integer as the value of the dictionary
        cntyDict.update({name: 1})

        # You can also use a list to save state names/codes or a dictionary for state names/codes as well as other information
        # cntyDict.update({name: [f['properties']['STATE']]})
        # Once more, think about the data structure that is necessary to help answer your questions
    else:
        # Do something here
        # The dictionary has already had the key, so that we know we should
        # 1) add 1 to the value associated with the key, if your dictionary value is integer, or
        # 2) add the state name/code to the list associated with the key, if the value is a list.
        pass

# Once you have the dictionary cntyDict. Sort it by value.

# kvItem is a (key, value) pair item from a dictionary
def sortFunction(kvItem):
    return kvItem[1] # The value in the pair

cntyDictSorted = sorted(cntyDict.items(), key=sortFunction, reverse=True)

# or use lambada
cntyDictSorted = sorted(cntyDict.items(), key=lambda item:item[1], reverse=True)

print(cntyDictSorted[0:3])
list(cntyDictSorted[0:3].keys())
For each state, find
- The number of counties
- The name and size (census area) of the biggest and smallest county by area
- The total and average area of counties
Think about what data structure you will need to derive the answers. Basically, we need a
dictionary with state name/code being the keyto reorganize the data.
Bonus Point
Using the JSON files for state fips and abbreviations, add state names and abbreviations to the county data above. You are also encouraged to write a new JSON file for the counties with full state name, abbreviation, and FIPS code.
Task 1 Code refactoring
This task is a pause-reflect-and-improve code refactoring practice. You are required to restructure your code from the first two assignments and to improve its internal structure and non-functional features. Specifically, you are encouraged to:
- discover, design, and create potentially reusable functions for your code.
- rewrite some of the code to make it more concise and more efficient using techniques like comprehensions.
- list comprehensions
- dictionary comprehensions
- set comprehensions
- generator expressions
- Add necessary comments and documentation to explain the logic and key steps.
Keep in mind that do not overdo it. For example, comprehensions are just a different form of for loops. Code looks very concise with comprehensions, but could be hard to understand. Comments are also very helpful, but the main body of a program file should be code, not explanatory text. Or the code should be self-explanatory. Overall, we need to strike a balance between being (syntax) efficient and being comprehensible. For those who are still behind the schedule, this is an opportunity to catch up. For those who have finished all the assignments, this is where you can try alternative approaches and gain a higher-level perspective on programming and code structure.
Task 2 OMNY's 7-day cap
This is optional with bonus points for GTECH 33100.
According to MTA, OMNY has the fare capping that is equivalent to the 7-day pass.
Simply tap and go with the same contactless credit or debit card, smart device, or OMNY card. Once you’ve hit 12 paid trips in a seven-day period, the rest of your rides for that week will automatically be free.
We will use simulated data to develop and test an algorithm that determines whether to charge a user when s/he taps an OMNY terminal.
First, we simulate a series of unique IDs for the payee devices (a card or a mobile phone).
import random
import string

s = string.ascii_lowercase + string.digits
n = 100200
payee_ids = [None]*n

# set the random seed, so results are replicable
random.seed( 1090 )

for i in range(n):
    payee_ids[i] = ''.join(random.choice(s) for _ in range(10))

# Using list comprehensions would be much more concise.
# But this is little bit hard to understand as it has two layers of list comprehensions
# payee_ids = [''.join(random.choice(s) for i in range(10)) for _ in range(n)]

# Exclude any possible duplicates (extremely unlikely, but possible)
payee_ids = list(set(payee_ids))[0:100000]

print(payee_ids[0:10])
Then, we add multiple times for each payee ID.
# import datetime and timedelta classes from the datetime module
from datetime import datetime, timedelta

fDate = datetime(2023, 9, 1)
tDate = datetime(2023, 11, 25)

dd = (tDate - fDate).days
nn = round(len(payee_ids)*dd*2.5) # on average, each payee makes two and half trips.

# This line should be removed or commented out for the final run.
nn = 100 # this number is used to debug the code.

# the time during the day does not really matter for OMNY rules. We just set it to a random number between 5 to 23.
payTime = [fDate + timedelta(days = random.uniform(0, dd), \
                             hours = random.choice(range(5,24)), \
                             minutes = random.choice(range(0, 60)), \
                             seconds=random.choice(range(0, 60))) for _ in range(nn)]

payees = random.choices(payee_ids, weights=[abs(random.normalvariate(0,1)) for _ in range(len(payee_ids))], k=nn)

simData = [list(x) for x in zip(payees, payTime)]
# Sort according to the time, from early to late.
simSData = sorted(simData, key= lambda z: z[1])

# Print the top 10 rows
for k in range(10):
    print()
    print("Index: {}, ID: {}, Time: {}".format(k, simSData[k][0], "" + simSData[k][1].strftime("%Y/%m/%d %I:%M%p, %A")))
So, we have the simulated data of a list of list, which contains the IDs of the payee devices and the corresponding times when they are used to pay MTA fares. Now, you can write code to determine if it should be charged a fare or not using the OMNY 7-day capping rule. The code should produces a float (fare) or a boolean (free or not) for each time or each "row" in the list.
For code development and debugging, you can filter the list and process the records of each ID. In other words, you can find out all the records for one single ID and process all the records associated with that ID as other records are not relevant to this particular ID. In the real-world application, it follows the same logic and would conduct a database query on the ID within the last 7 days.
Note that the logic is not that an ID will not pay if it has paid 12 times in the last 7 days. When an ID has paid 12 times within 7 days, it creates a 7-day window within which one does not have to pay more than 12 times. The window must be reset after the 7-day window expires. This is the most common logical error for this application.
The following is one way to present the results. Alternatively, you can use boolean value to show if it is free or not.
for k in range(10):
    print()
    print("Index: {}, ID: {}, Time: {}, Charge: ${}".format(k,
        simSData[k][0],
        "" + simSData[k][1].strftime("%Y/%m/%d %I:%M%p, %A"),
        random.choice([2.90, 0.00]) # This random value should be replaced by values from your algorithm.
    ))
Task 1 Create Python Classes
Follow the example, add a class of Triangle. Write testing code to verify the new class works as expected.
import math as mth
import random
Set up a Geom class for all geometric figures which all know their name and color
class Geom():
  geomType = 'Generic Geometry Type'

  # Constructor of the class: used to initialize an object
  # It could have optional parameters.
  # If the caller does not provide name and color, random values will be assigned.
  def __init__(self, name = None, color = None):
    # Check out the names and the faker packages for random names
    self.name = name if not name is None else random.choice(['Bill','Sally','Tamica','Josh','Lammar','Hussain'])
    self.color = color if not color is None else random.choice(['BLUE', 'RED', 'PURPLE', 'YELLOW'])

  # This is a method that all children will inherit.
  # In other words, all children will have this method without explicitly defining it.
  def print_name(self):
    print('My name is ', self.name, 'and my color is ', self.color)

  @classmethod
  def area(self):
    return None

  # Another method: why we can call self.area without defining it here?
  def makeString(self):
    return f"Name: {self.name}, Color: {self.color}, Area: {self.area()}"
Now create subclasses of the geometry types
class Circle(Geom):

  def __init__ (self, r):
    self.radius = r
    super().__init__()

  # area method
  def area(self):
     return mth.pi * self.radius **2
class Square(Geom):
  #
  def __init__ (self, s):
    self.side = s
    super().__init__()
  # area method
  def area(self):
     return self.side **2
Now create an instance of a square
side = 8
my_square = Square(side)
print('Length of the side is', my_square.side)
my_square.print_name()
print('My area is ', my_square.area())
Create a list of circles with radius i (2,3)
circle_list = [Circle(i) for i in range(2,4)]
print(circle_list)

for x in circle_list:
    x.print_name()

print([x.makeString() for x in circle_list])
Task 2 Create a Package
Reorganize these classes as a package with one or multiple modules. Import them into another Python Notebook or Script file to test them.
The purpose of this task is to understand the concepts of methods or functions, classes, modules, and packages as well as their relationships and organization in Python. This would help us comprehend the real meaning of (from ...) import .... More importantly, it is always good to organize your well-developed code as a package so that it can be extensively used by other members in the community.
Check out the sample code shared through Dropbox (Sample_Code/Package_Example folder). Pay particular attention to the directory structure of the Python files in terms of why and how they are modules or packages. From the perspective of using packages and modules, read the various ways of importing packages, modules, and methods/classes in the example Jupyter Notebook.
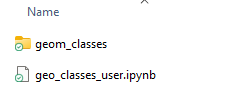
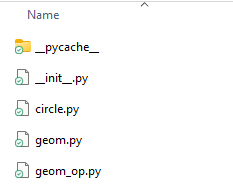
When submitting to the Brightspace forum, remember to post one or more images to show the file/directory structures like the one below.
Task 1 Install Plotly
Install the plotly and other data visualization packages using either pip or conda.
For those who want to explore more advanced feature of Python, create a new pyvis environment and install those packages to that specific environment, instead of the base environment.
Task 2 Visualize Data using Plotly
Using the data from Assignment 2, produce at least three types of charts using plotly or other packages of you own preference. For example, you can plot the distribution of state or county areas, the distribution of common county names, and the distribution of the number of counties in states. Directly show those charts in Jupyter Notebook, if applies.
Alternatively, you can use pandas to load some tabular data, such as in csv file, for the charts.
The fallback option is to use the sample data available from the plotly package. However, two points, i.e., 20%, will be taken off if you choose this option because those online examples are using such data.
Task 3 Export Plotly Visuals
Export at least one chart to a static image and one chart to an HTML page, using Python code.
Task 1 Install GeoPandas
Install the geopandas package.
Once more, you can explore the Python environment options. You can either choose an environment other than the base (if you have created some environments before) or create a new environment for the geospatial packages.
Task 2 Process Spatial Data with GeoPandas
Find at least three sets of spatial data, in Shapefile, zipped Shapefile, GeoJSON, or other supported formats. If you have well-prepared data from previous works, you can also use them. You can use the three zipped files in the Code folder on Dropbox, which are the new electoral district maps in NYS.
Import those data into GeoDataFrame using geopandas. Take one dataset as an example, show the specific types of the entire dataframe, the geometry column, and individual geometry object. This also helps you get familiar with pandas subsetting (choose rows and columns from the tabular data).
Export all three into a SINGLE geopackage file (geodatabase). Note that the single geopackage file should have three layers inside, not three layers in three separate geopackage files.
Task 3 Make Maps using GeoPandas
Use basic web mapping methods in geopandas to visualize the data. Feel free to explore all the mapping parameters for those functions.
Though not required, you are also encouraged to use plotly.express to draw these maps.
Task 1 Develop Python tool in ArcGIS Pro
Using arcpy and/or arcgis packages from ESRI ArcGIS, create a script tool for Geoprocessing or a Notebook in ArcGIS Pro. Alternatively, you can create a generic Jupyter Notebook using these two packages from ESRI.
Task 2 Plan Final Project
From now on, you are expected to plan on your final project. Try to make the assignments part of your final project whenever it applies. At least, you should use the assignments to verify the methods or technologies for your final project. If you haven't had a direction for your project yet, you can recycle what you did in other GIS courses and see if you can automate some of the manual works and make a nice Geoprocessing tool or Python Notebook.
Apply Pandas and GeoPandas to Spatial Analysis
Revisit assignment 2 and finish the tasks using pandas and geopandas, instead.
The tasks are
- Find top n most common county names (n = 3 or 5, for example)
- Derive summary statistics for states, for example, number of counties, counties with max/min area
- Join fips code to get full names of states (please do a real join using merge)
- Plot maps to show all the counties with the most common names from first task
Proposal
Write a proposal for your final course project. At least one page is expected. The project could address a specific application question or develop a tool/system. In either case, a final report is required. A sample proposal template is as follows.
Course Project Title
An informative but concise title
Introduction/Background:
Provide a brief overview of the topic of your project.
- What are the current state of research and practice in this area?
- What are the key challenges that need to be addressed?
- What are the goals and objectives of your project?
Questions to be Answered or Issues to be examined:
- What are the specific questions that you will be addressing in your project?
- Or what specific issues will the project examine?
- How do these questions relate to the broader research and practice in this area?
If you plan to develop new tools or systems:
- What are the key functionalities of these tools?
- What is the format of the tool, a set of Python functions, a Python module, a Python package, an ArcGIS Geoprocessing tool, a Python tool with GUI?
- How will the tools or systems be tested?
Data and Methodology:
- What data will you be using in your project?
- Where and how will you collect this data?
- How will you ensure that the data is reliable and accurate? Or how do you know that you used the best source?
- What data processing and analysis methods are you planning to use? What Python packages will you use primarily?
Expected Results:
- What are your expected results for your project? Tables, charts, maps, websites, multimedia?
- Will you share the results publicly on the Internet? If so, how?
- If applicable, how will you quantitatively measure the success of your project? Or how do you know that you have accomplished the goals of your project?
- Timeline and Budget (not really applicable to a course project, but good to think about them):
- Provide a detailed timeline and budget for your project.
- How will you allocate your time and resources?
References:
- List any relevant references that you have used in your proposal or will use for the final paper.
Presentation
Create a presentation file (PowerPoint or PDF), with which you will present your project to the class.
- The presentation should not be longer than 8 minutes.
- Briefly introduce the background, data source, data processing, code organization, and key findings/functionalities.
- Leave some time for Q/A, where we may ask questions about the implementation details.
Final Project Report
The final project report is expected to be ten or more pages with Times New Roman font size 12, one inch margin, and 1.5 lines spacing. It could be formatted as a Word, PDF, or a Web-based Notebook. For a "regular" research project, please refer to the following guideline for necessary sections and paper format. For tool development, Results section should focus on functionalities and testing results.
The final project paper should generally have the following structure. This structure is typical for research works using quantitative methods.
Title: with author and institution information
Abstract: 250 words or less summarizing the research background, research questions, data and methodology, and main findings.
Keywords: 3 to 5 keywords to categorize the topic of your paper
Main text:
- Introduction: background, significance, goals and objectives, specific research questions, possible contribution of the research, structure of the paper
- Literature Review: history, development, latest progress on the research topic, what others have done regarding theories, opinions, data, methods, and findings. Give a good synthesis of the relevant knowledge. Do NOT list and summarize publications one by one. Develop a conceptual framework from the literature and fill in specific papers to each part in the framework. It is very challenging to write a good review. NEVER underestimate the difficulty of writing this section.
- Data and Methodology: describe the data sources and main methods used to address the question. Clearly lay out the main steps of the data processing and analysis, so other people can replicate the analysis if they are interested in the work. Do NOT explain well-known methods in details. For example, there is no need to elaborate buffer or shortest path analysis. It is good enough to mention their names.
- Results: Present the results, explain the resultant statistics, maps, figures, and/or tables. Do NOT leave the interpretation work to the readers. Just showing the tables, figures, and maps is not enough. EXPLAIN them and interpret the results.
- Discussion: discuss the implications of the results and how the results answer your research questions. You can also relate your results to the bigger context in terms of how your results support existing findings, shed new lights, or make contrast to known theories. This part could also include limitations and caveats.
- Conclusion: main findings, take-home points, future works It is also widely accepted that the Discussion and Conclusion sections are integrated into a single “Discussion and Conclusion” section.
Acknowledgements (optional): if extra help was received from other people or organizations for funding, technical support, data, or in other aspects, they could be acknowledged in this section.
References: papers, publications, books, data, and websites cited in the paper. All references should be prepared in APA or other academic styles. No matter what style the project paper uses, it must be consistent, i.e., all citations and references have the exactly same style.
Appendix (optional): if extra materials do not fit in the main text, they can be presented in the appendix section.