Reclassifying raster
data
Reclassification is the
process of reassigning a value, a range of values, or a list of values in a
raster to new output values.
![]() Why reclassify your
data?
Why reclassify your
data?
One reason is to set specific values to NoData to exclude them from analysis. Other reasons are to change values in response to new information or classification schemes, or to replace one set of values with an associated set (for example, to replace values representing soil types with pH values). Still another reason is to assign values of preference, priority, sensitivity, or similar criteria to a raster.
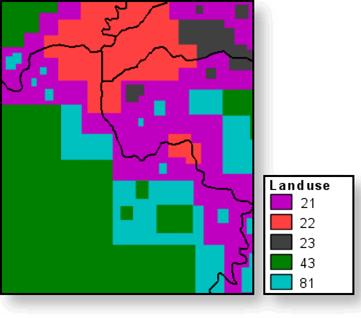
With categorical data,
values may be reclassified with a one-to-one value change. For example, while
performing a deer habitat analysis, the values on a land use raster, each
representing a different type of land use, need to be changed to a preference
range of high, medium, and low, (e.g., values 1, 2, and 3). The types of land
most preferred by deer are reclassified to higher values and those less
preferred to lower values. For instance, forest is reclassified to 3, pasture
land to 2, and low-density residential land to 1. Areas where no deer in his
right mind would go, like urban and industrial might be reclassified to NoData.
|
|
|
|
Input discrete raster |
Reclassifed raster |
|
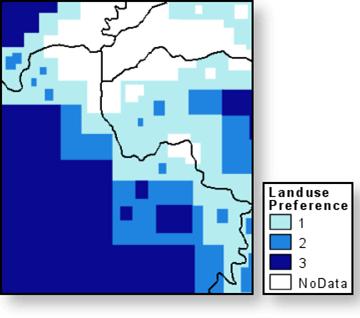
Reclassification of categorical data
involves replacing individual values with new values. For example, land use
values can be reclassified into preference values of low (1), medium (2), and
high (3). Land use values not desired in the analysis are given values of NoData. Move your mouse over the links above to see the
effects of reclassification on the land use raster. |
|
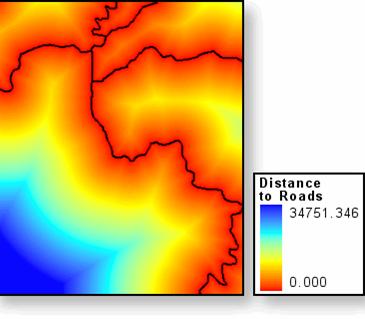
With continuous data, value
ranges may be reclassified into a specific number of groups. In this
hypothetical analysis of deer habitat, the second layer in the suitability model is based on the preference of deer for
locations far from roads. A distance map (continuous data) is created from the
existing roads theme. Instead of individually reclassifying each of the
thousands of distance values on a 1-to-3 deer preference scale, the values can
be divided into 3 groups. The farthest group receives the highest deer
preference value, a value of 3, and the nearest group, a value of 1.
|
|
|
|
Input continuous raster |
Reclassifed raster |
|
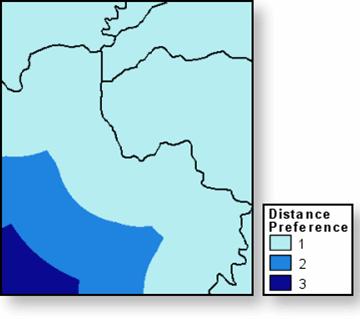
Reclassification of continuous data involves
replacing a range of values with a new values. For
example, a raster depicting distance from roads can be reclassified into
three distance zones. Move your mouse over the links above to see the effects
of reclassification on the distance to roads raster. |
|
Reclassification is an
important process when you need to combine dissimilar data using a common value
scale. In the deer habitat model, additional rasters
of soil type, slope, aspect, and vegetation might also be reclassified on a
suitability scale of 1 to 3. These rasters, which
originally held values belonging to different measurement scales, could then be
added to find the most suitable site.
When you use the Reclassify
function on the Spatial Analyst toolbar, you have the option of saving a remap
table. This makes it easier to apply the same reclassification to your data at
a later date.
![]() Learn more about
remap tables
Learn more about
remap tables
Saving
a remap table will enable you to load it again at a later date. The format of
this table is such that it allows the mapping of NoData
values to a value; mapping a value, range, or string to nodata;
or mapping strings to new values.
A
remap table consists of two parts. The first part identifies the particular
cell value that is to be reclassified, and the second part is the cell’s
reclassified output value.
For more information about remap tables, consult the ArcGIS online help.