Kriging
Getting to know the Kriging method involves delving into the mysterious world
of probability and prediction, which, depending on your understanding of
statistics, could lead either to years of therapy, or to your Ph.D.
Like IDW, Kriging is a weighted average technique, except that the
weighting formula in Kriging uses much more
sophisticated math. Kriging measures distances
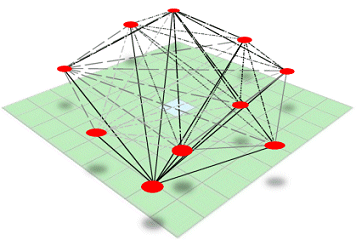
between all possible pairs of sample points (that’s right, all of them)
and uses this information to model the spatial autocorrelation for the
particular surface you're interpolating.
In other words, Kriging tailors its calculations to your data by analyzing
all the data points to find out how much autocorrelation they exhibit and then
factors that information into the weighted average estimation.
When you interpolate a
surface using Kriging, the distance and direction of
every point pair is quantified to provide information on the spatial
autocorrelation of the sample point set. Next, a best-fit model is
automatically applied to the data and the unknown values are predicted.
Kriging aficionados consider the initial kriged surface a first draft—a test surface against
which they compare future iterations as they search for the perfect surface.
Directional influences, such as prevailing winds and random error, can be
accounted for using Kriging, but you will need a
statistical tool such as ArcGIS™ Geostatistical Analyst to visualize these trends.
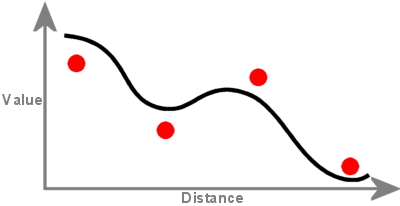
A surface created with kriging can exceed the value range of the sample points,
but will not pass through the points.
Two general and widely used Kriging methods are Ordinary and Universal Kriging. Universal Kriging
assumes that there is an overriding trend in the data. For example, you may
know that there is a prevailing wind or a gently sloping hillside across your
study area. Ordinary Kriging assumes there is no
trend in the data, which should be your standard operating assumption.